Interesting Findings
Some examples of what you can discover playing with our app
Chicago-wide Patterns
At a low level of zoom and leveraging the fact that at this level the markers are circles that form a sort of heatmap, we can easily see and study various patterns around the city.
These patterns many times are repreented by clusters of circles on the map and from them we can derive different evaluations and inferences.
Street Issues
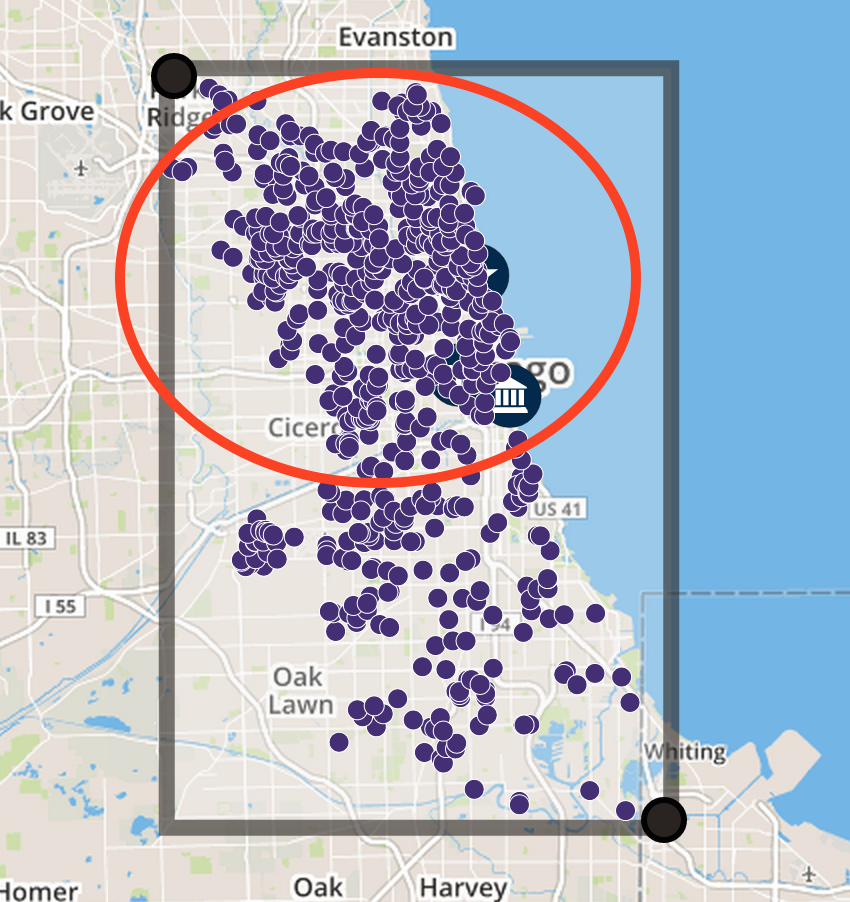
Potholes distribution: we can notice that the main cluster can be identified in the upper half of the city, while in the south the signalled potholes are far less present.
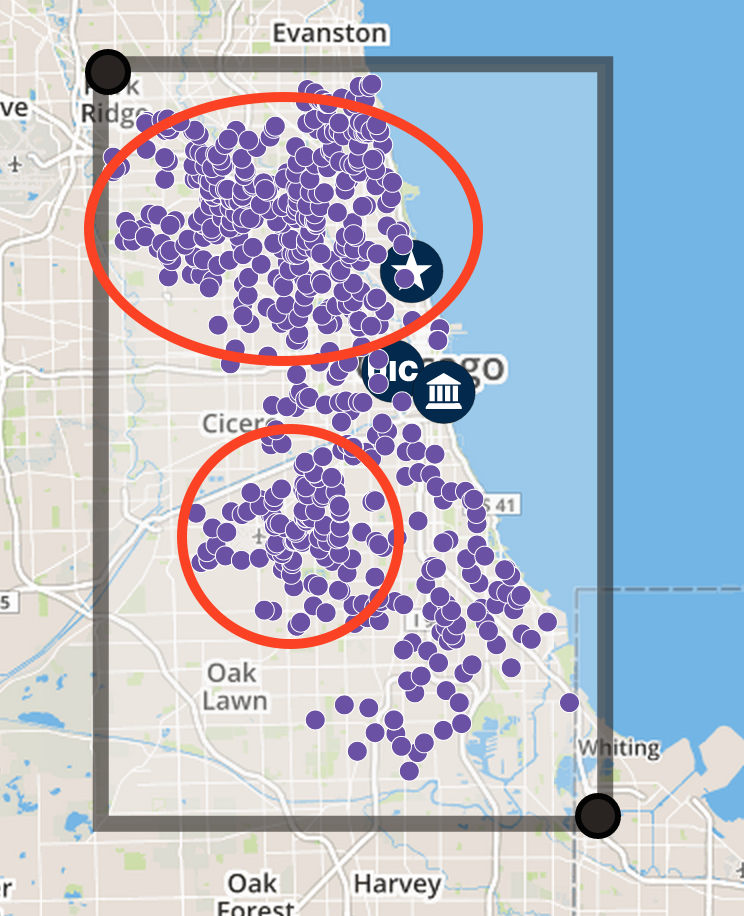
Abandoned Vehicles distribution: we can notice some of the main clusters; the biggest one is still in the northern area of Chicago.
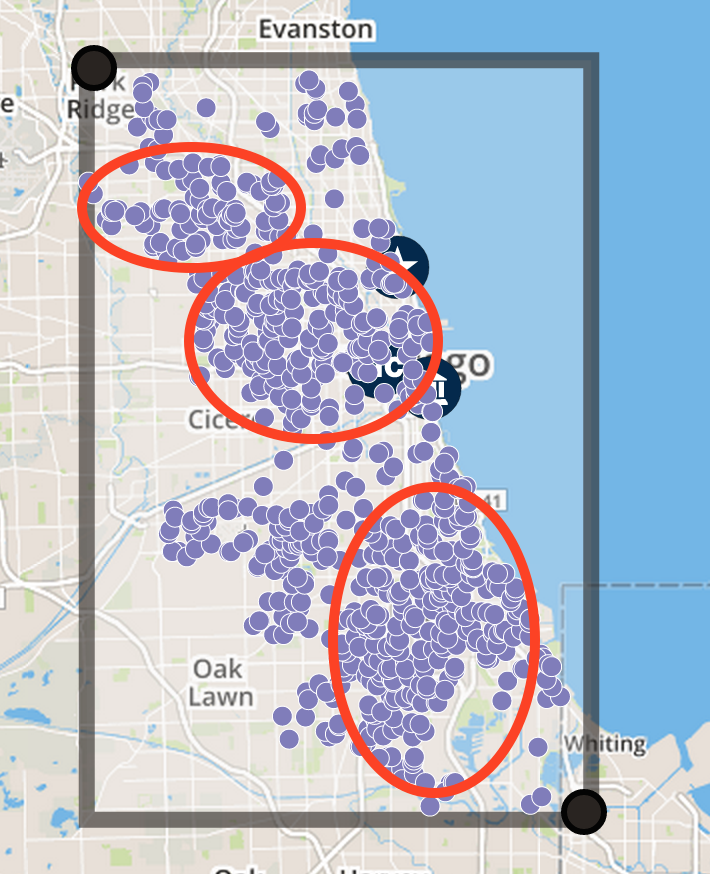
Street Lights Out distribution: here the main cluster can be identified in the south.
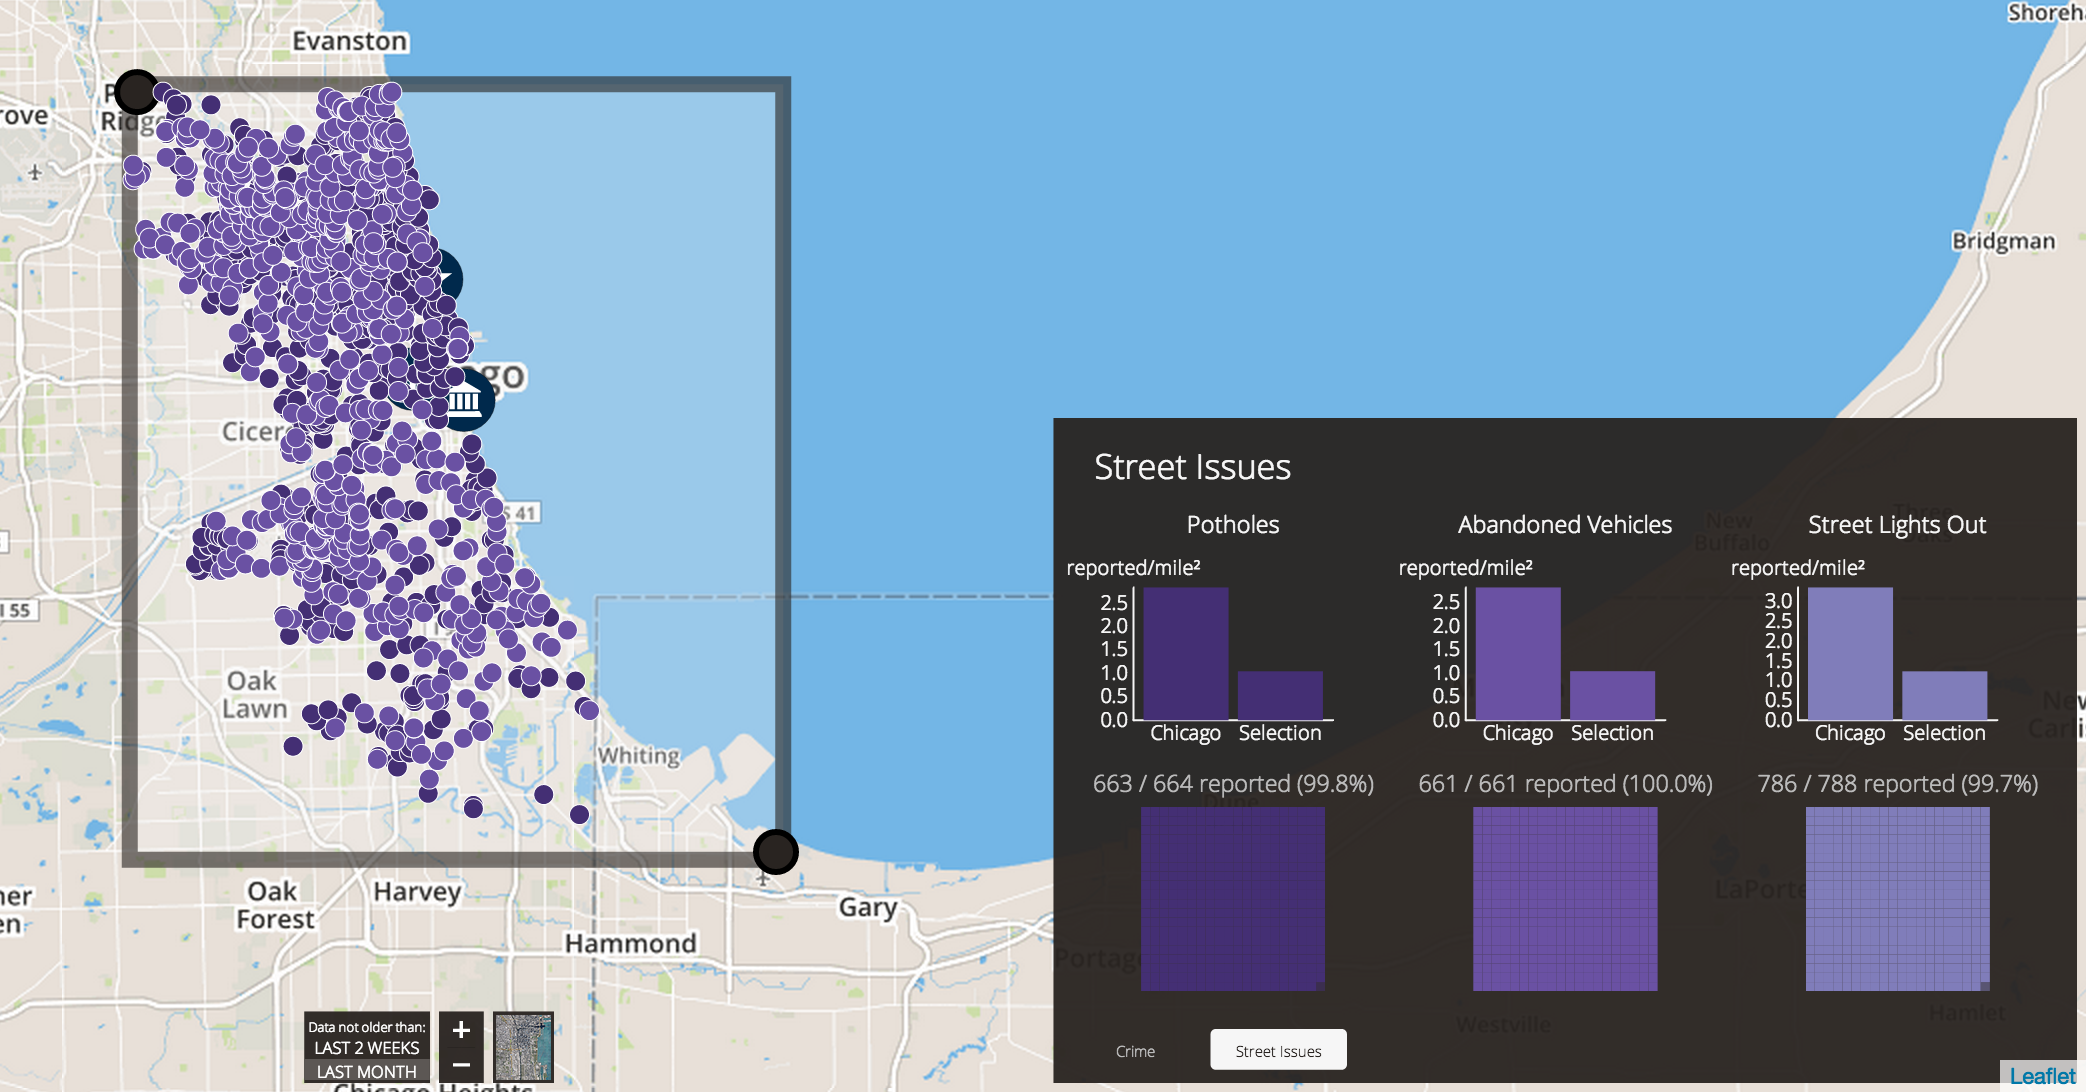
Street Issues overall distribution
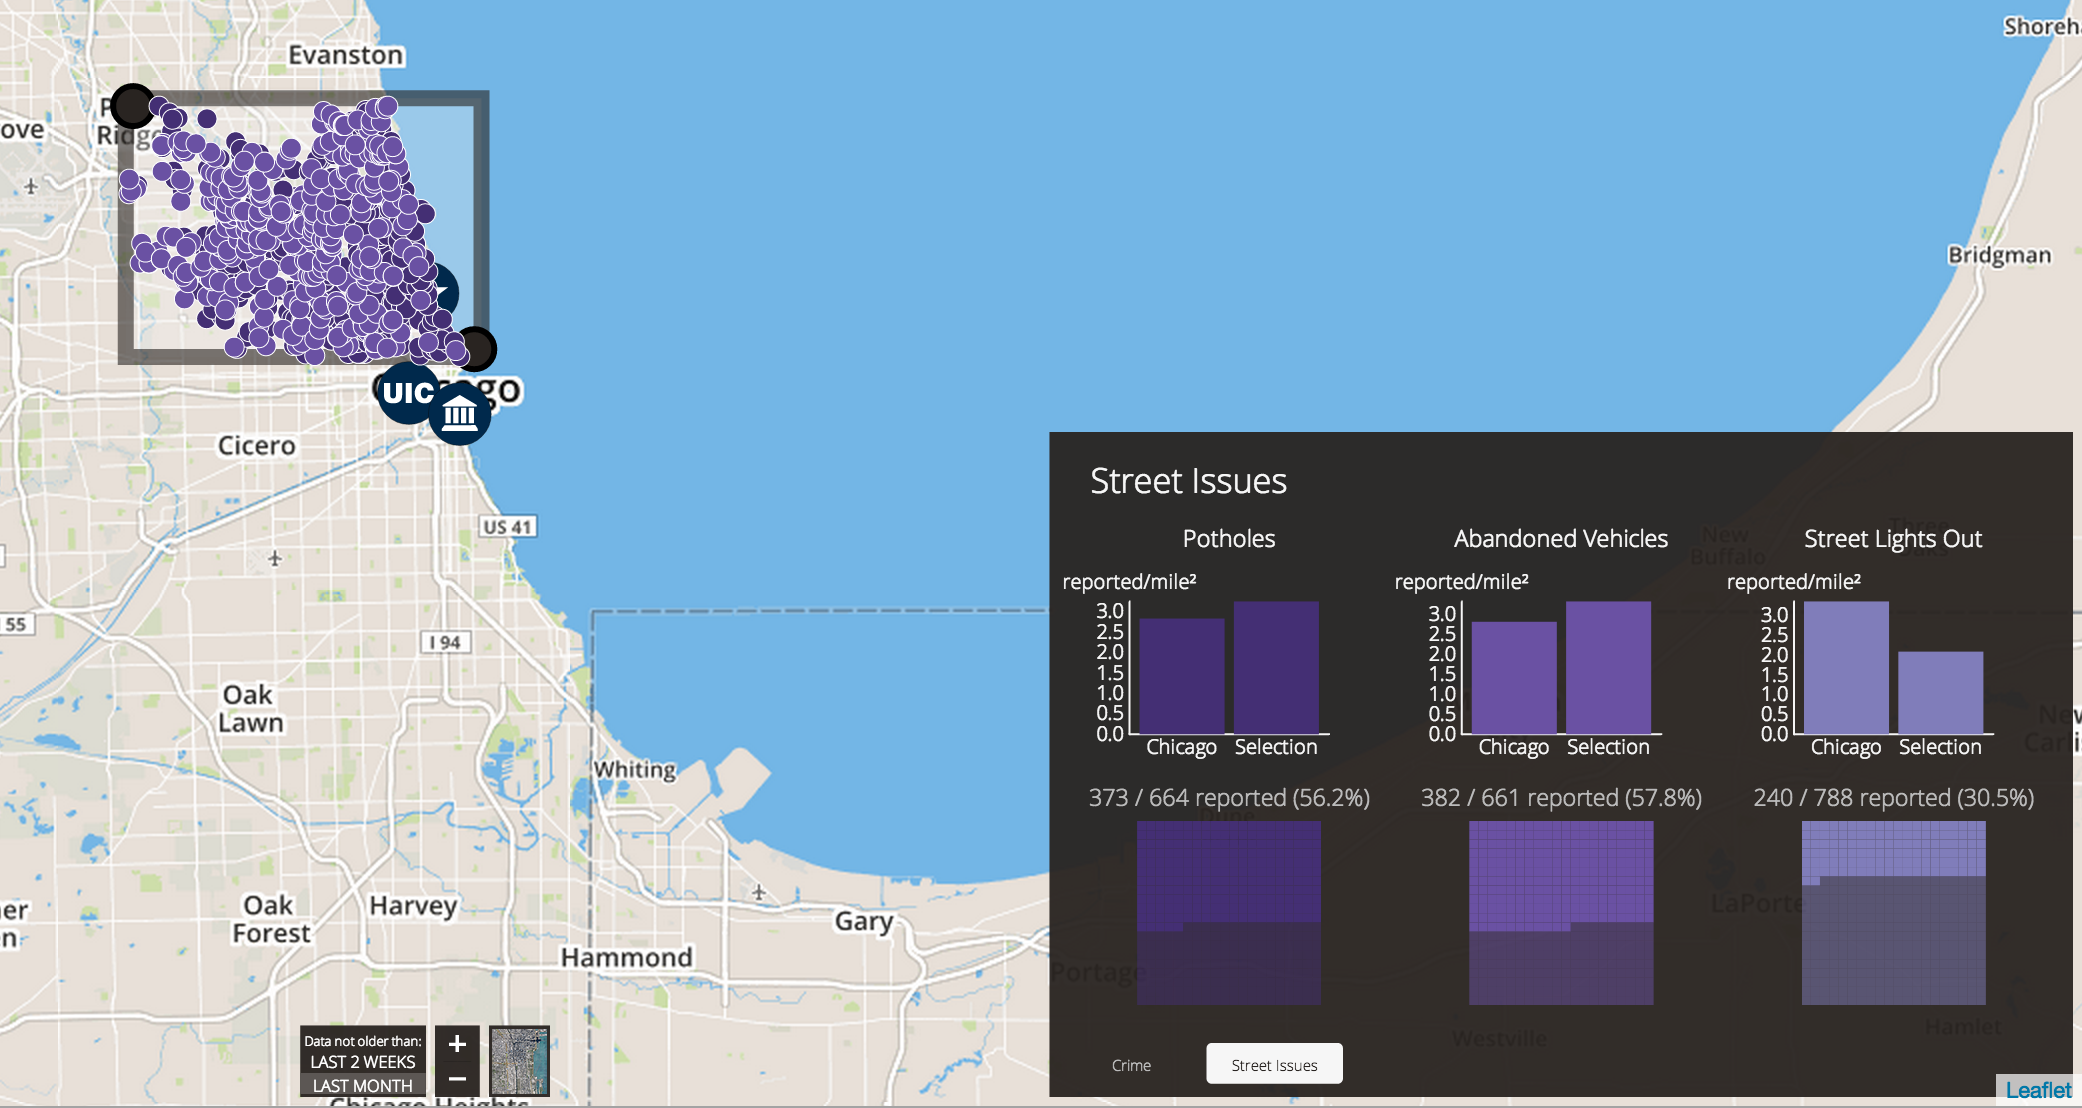
Street Issues distribution, north: to support what already discovered before, we can notice that both potholes and abandoned vehicles are mainy concentrated here, in fact they cover over a half of the total number (matrix plot).
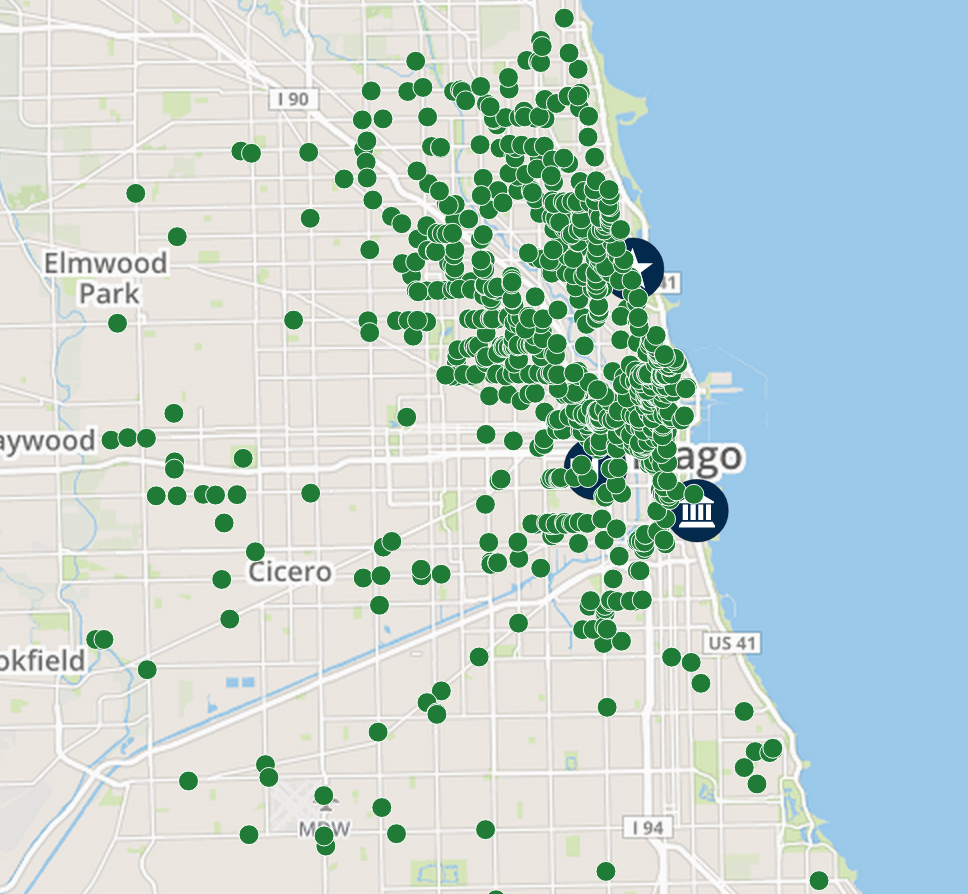
Crimes
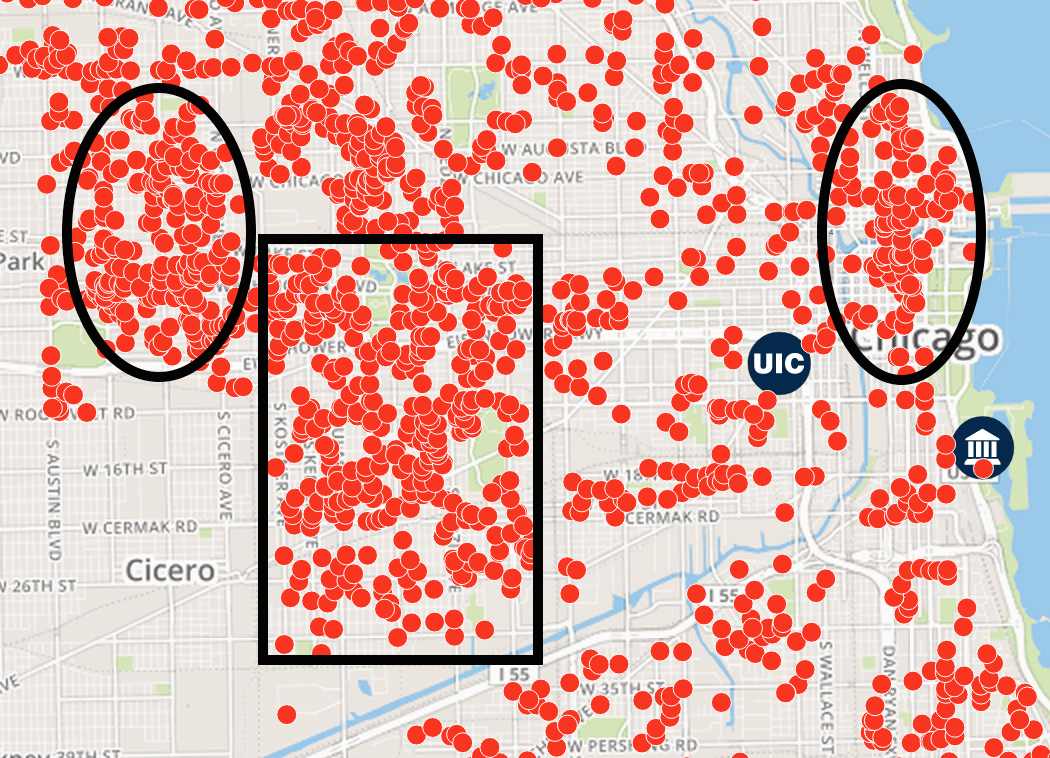
Violent Crimes distribution
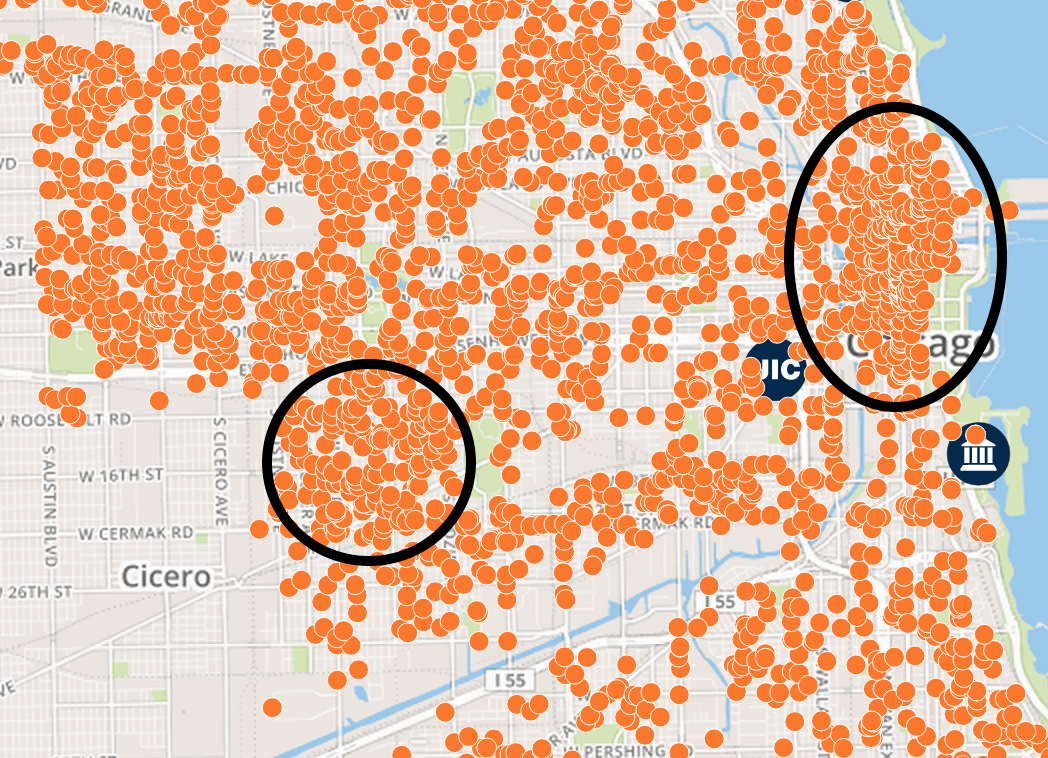
Property Crimes distribution
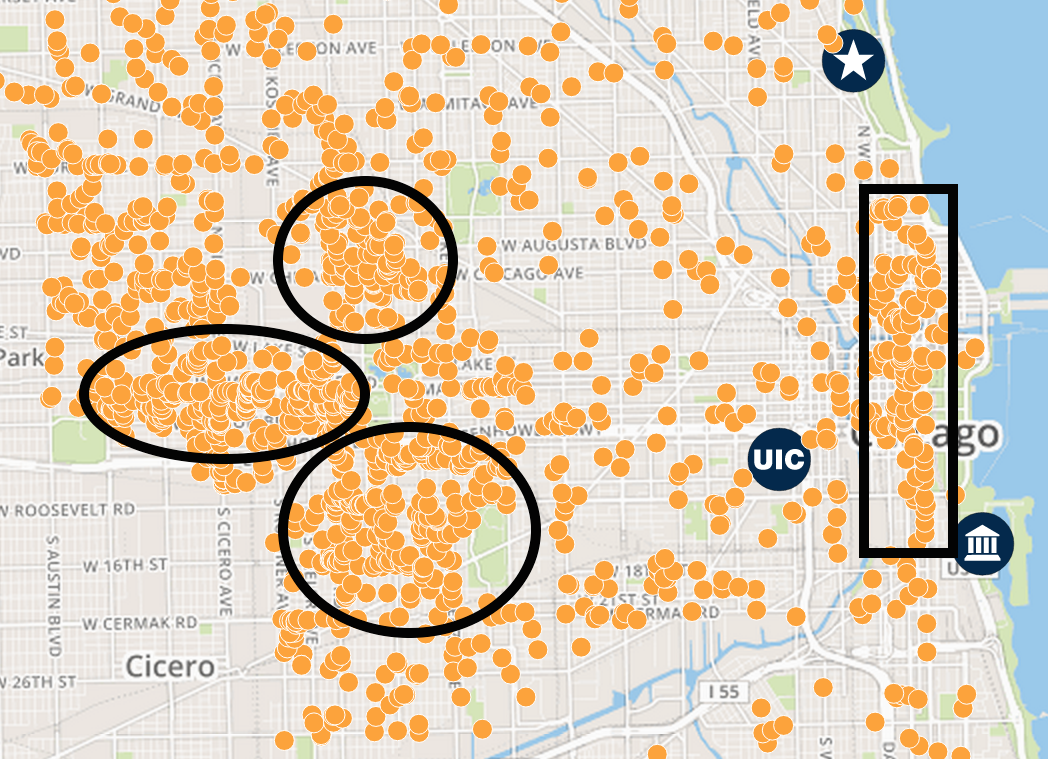
Quality-of-life Crimes distribution
From the distributions, we can notice in particular that some clusters are common to different types of crime for the same area.
For example, all the three categories of crimes are widely present in the Loop zone and in the central-west area.
Restaurants
Top Restaurants distribution
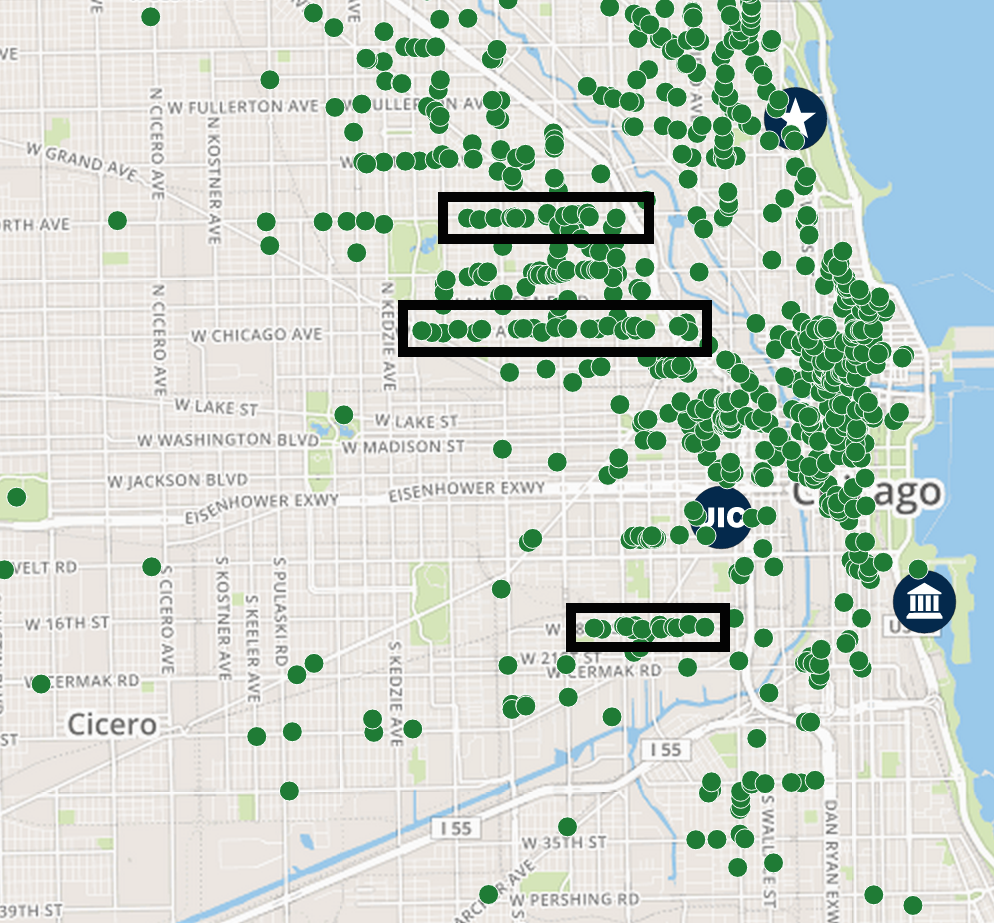
Top Restaurants distribution - detail: we can clearly notice that the restaurants are mainly distributed along some specific streets, in fact they tend to concentrate in specific places where people can go to eat throughout the city. Without much surprise the top location is the central area (Loop and River North).
Crime Patterns
We can use the charts and tables related to crime data to find out interesting aspects.
Correlation between crimes' type and location
If we look at the tables for the crime locations, we can soon notice that the top locations are strictly correlated to the geographic areas where the crime happened.
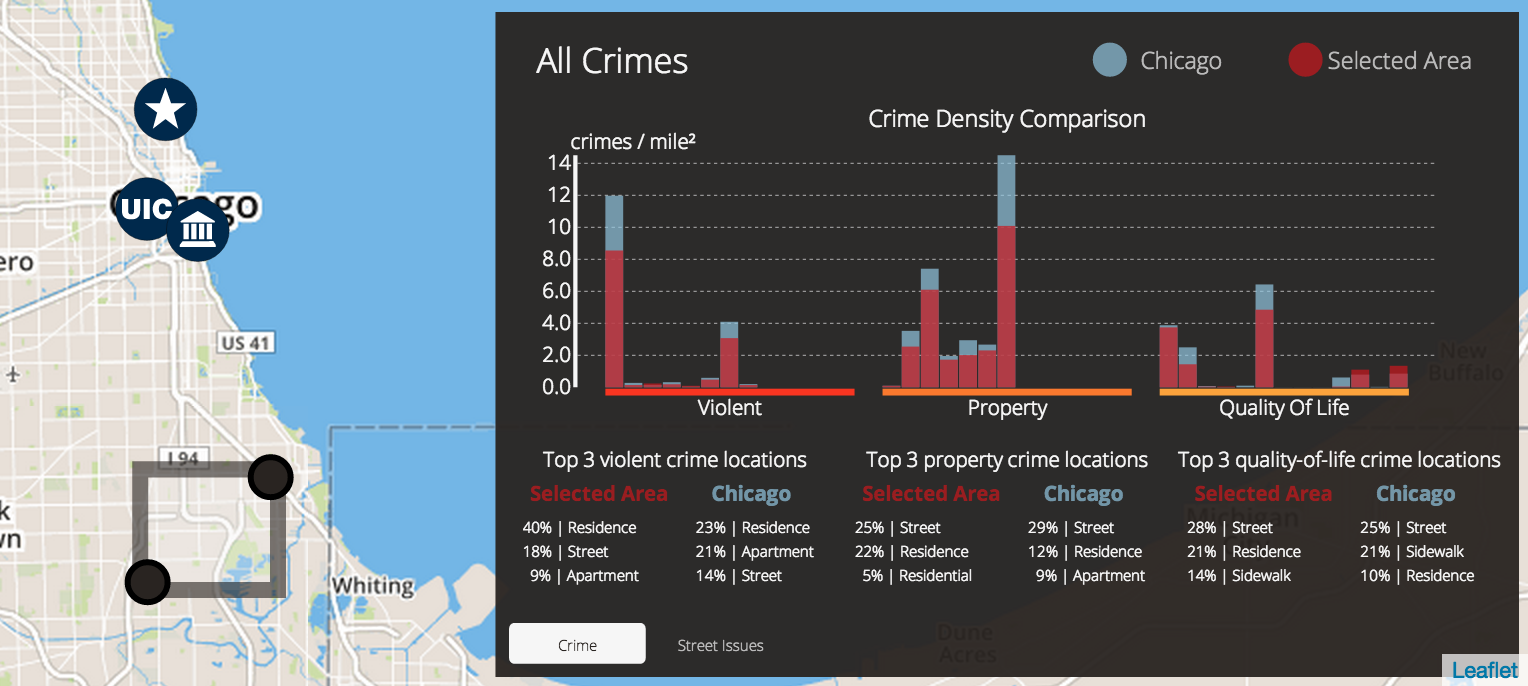
In this picture we selected an area of the far south suburbs. We can notice that the crimes happen mostly on the streets and in residences for violent crimes.
Moreover, the locations here coincide with those of Chicago, so we can infer that the overall trend of the city is given by the locations of crimes which happen in suburban areas like this one.
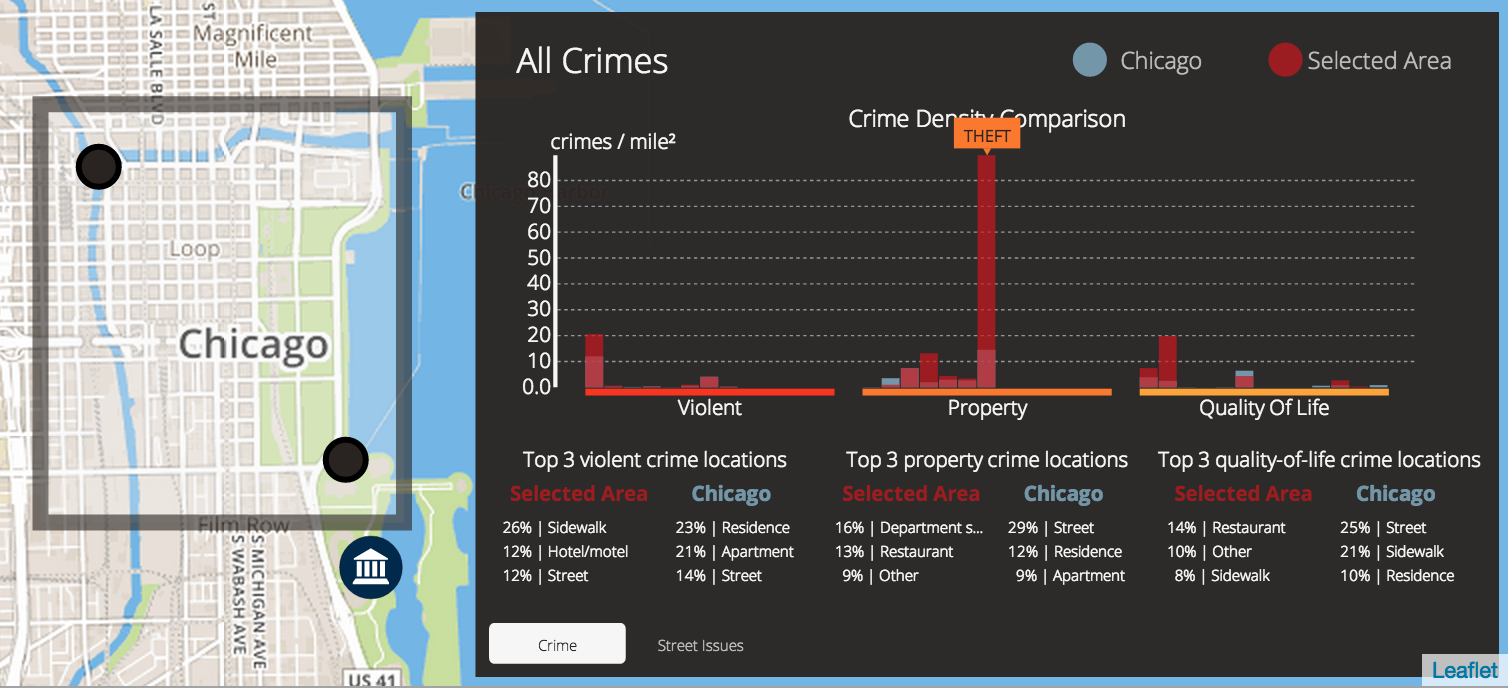
In this picture we look at the crime locations in the Loop. In contrast to what happened with the suburbs, here the trend is quite different from that of the city: violent crimes happen mostly on the sidewalk and not in private locations such as residences; property crimes happen mostly in department stores and restaurants, which makes sense since this is the commercial and turistic area of the city.
Let us focus on the quality-of-life crimes' locations:
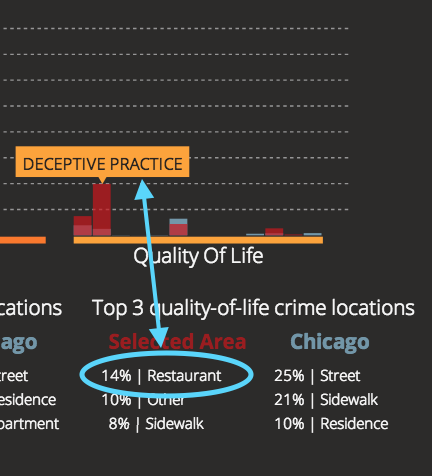
In the Loop, the top location for quality-of-life crimes are restaurants. If we look at the detail of the types of crime we can notice that here the most popular crime is "deceptive practice". This crime here has density per mile which is far higher than the overall city one (as we can see from the barplot).
This can be easily linked to the location of crimes: in the Loop many restaurants are sued for deceptive practices towards their customers, for example deceptive billing practices are very common here.
UIC area
In the area around UIC recently the most common crime is theft. This is in line with Chicago as a whole, in fact theft is by far the most common crime.
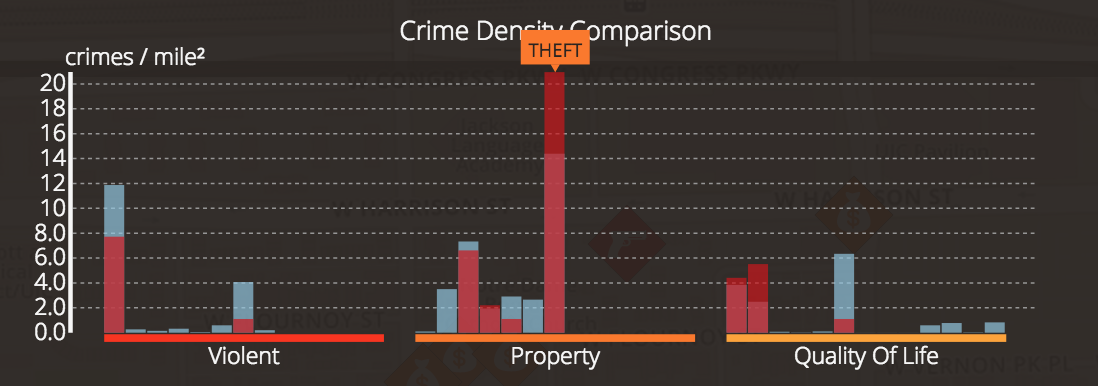
Theft in the UIC area reflects the Chicago trends.
Another interesting fact is that the most common quality of life crime in the last month in the UIC area is deceptive practice, and this crimes are mostly located in the hospital. Interestingly opening the popup at the Cook County Hospital the crime involves a financial identity theft.
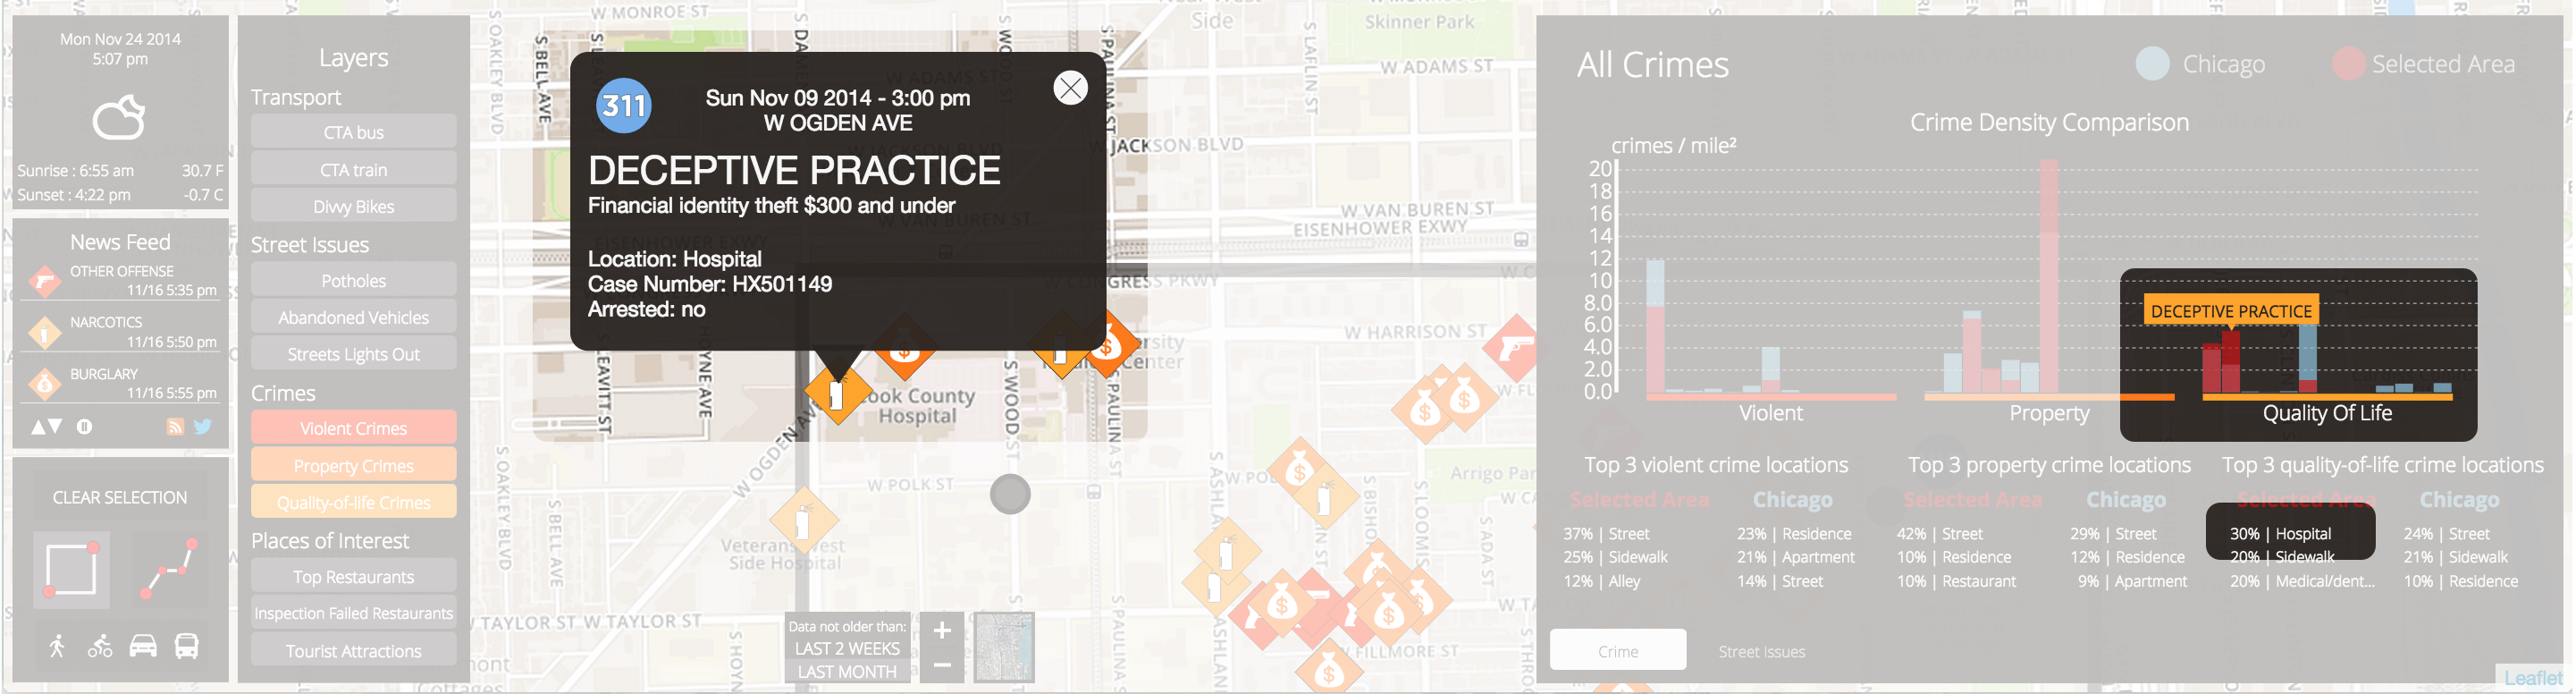
A popup showing a financial identity theft at the Cook County Hospital.
Another fact to point out is that at least in the last month violent and property crimes have been located between the west and the east campus, but the campuses themselves seem to be safe since no crime has happened within. Moreover most of the crimes involves theft for around $500 and this seems reasonable since the area is populated by students which often carries laptop or other expensive device with themselves.
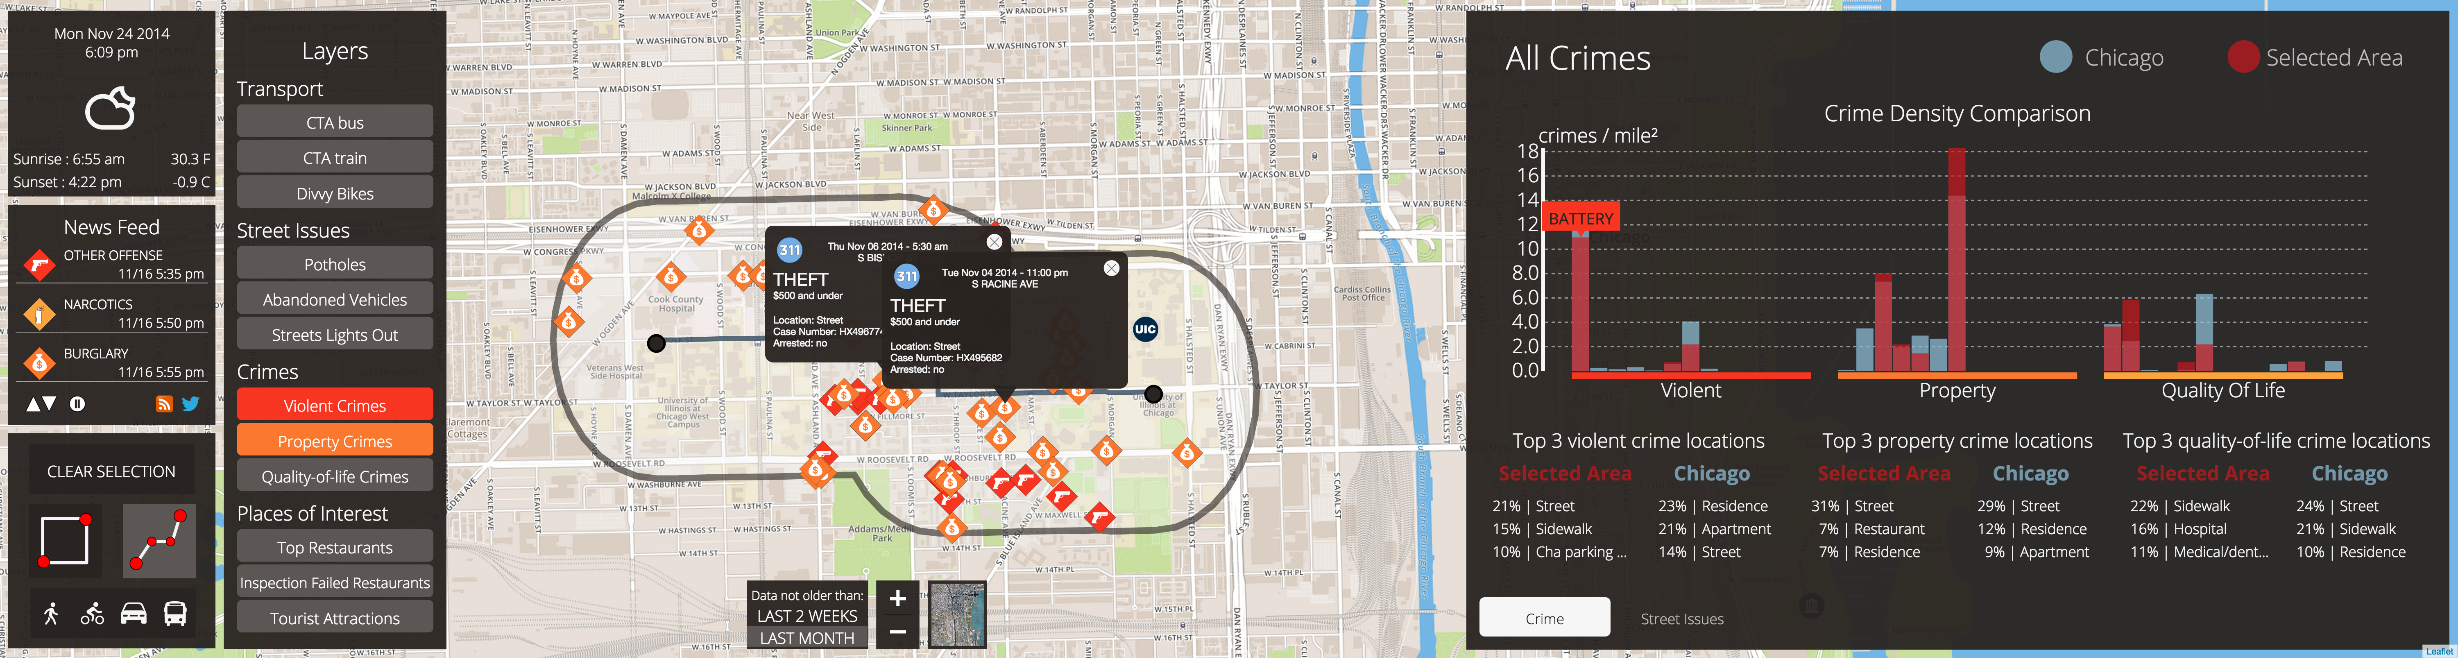
Crimes between UIC campuses. Most of the crimes involves theft of $500 or under.
Curious Facts
City of Chicago Auto Pond
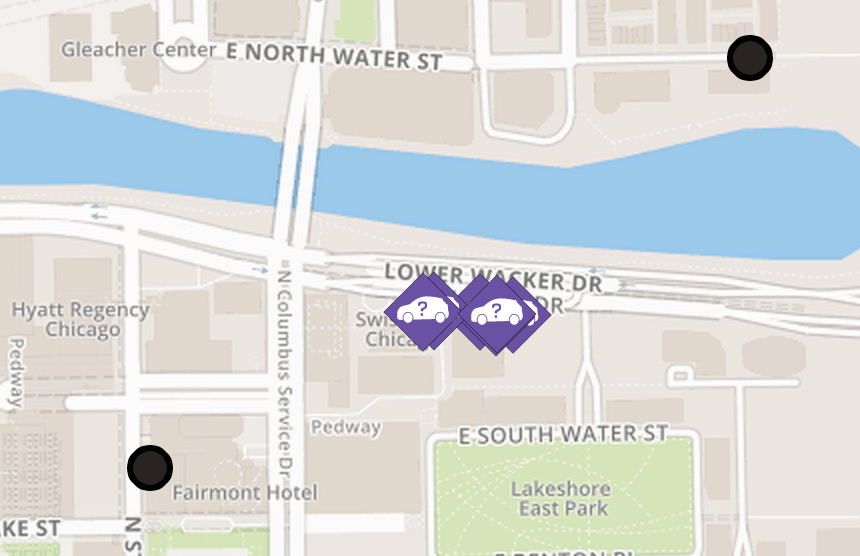
One of the very first findings we did was related to a high concentration of abandoned vehicles on Wacker Drive.
It was a strange fact, both because it is difficult to have such a concentration of abandoned vehicles and because the place is in the Loop, so it is unlikely to have so many abandoned vehicles.
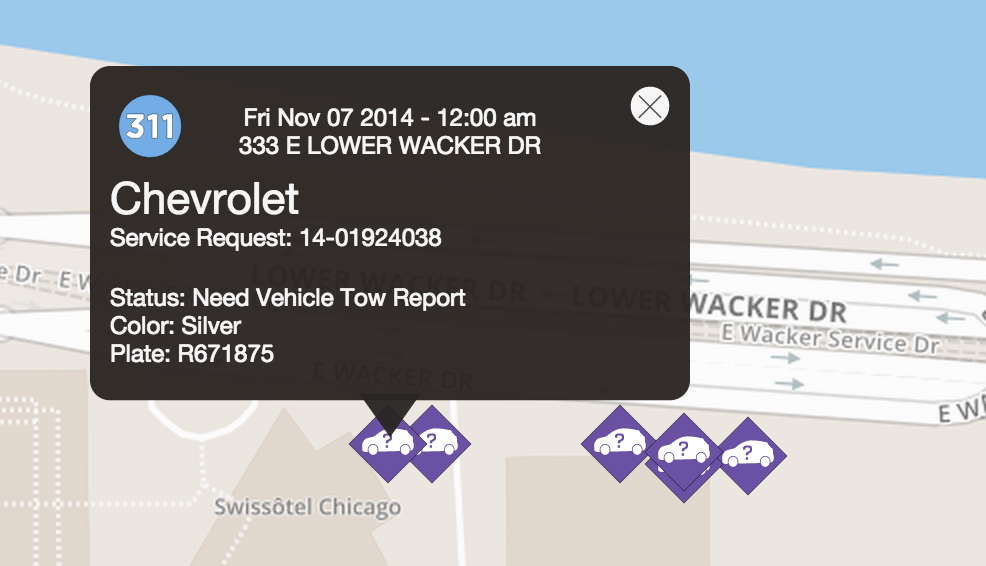
Turns out, after some further investigation, that in this place there's the "City of Chicago Auto Pond", where many of the towed vehicles get delivered.
So the evidence suggest that many abandoned vehicles are probably discovered elsewhere and towed to this place: these vehicles are of low interest for the user's trip decisions, but it is anyway a nice discovery.